Candlestick patterns are a cornerstone of technical analysis, providing traders with visual cues about market sentiment and potential price movements. By understanding and interpreting these patterns, you can make more informed decisions, improve your timing, and enhance your overall trading strategy.
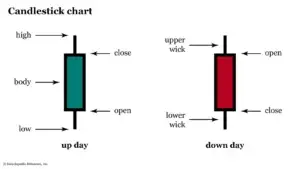
Candlestick charts were originally developed in Japan centuries ago to track the price movement of rice. Today, they are used worldwide to represent price action for all types of assets, including cryptocurrencies. Each candlestick represents a specific time period and shows the opening price, closing price, high, and low for that interval. The shape and color of the candlestick body and wicks (or shadows) convey valuable information about how the market is behaving.
Crypto markets are known for their volatility, with prices often swinging dramatically in short periods. This volatility makes candlestick patterns particularly useful. By analyzing how candlesticks form and recognizing recurring patterns, you can anticipate potential reversals, continuations, or periods of consolidation. This insight can help you better plan your entries and exits, reducing the impact of emotional decision-making.
Doji: A doji candlestick forms when the opening and closing prices are nearly identical, resulting in a very small or nonexistent body. This pattern reflects market indecision and often precedes a reversal or a significant move.
Bullish Engulfing: A bullish engulfing pattern occurs when a small bearish candle is followed by a larger bullish candle that completely engulfs the previous candle’s body. This pattern suggests that buyers have taken control, signaling a potential upward move.
Bearish Engulfing: Conversely, a bearish engulfing pattern forms when a small bullish candle is overtaken by a larger bearish candle. This indicates that sellers are gaining strength, potentially pushing the price downward.
Hammer and Inverted Hammer: The hammer pattern features a small body and a long lower wick, showing that while sellers initially drove prices lower, buyers stepped in to push them back up. An inverted hammer has the opposite structure and can also signal a potential reversal.
Shooting Star: A shooting star has a small body near the lower end of the candlestick range and a long upper wick. This pattern often appears after a price rally and may indicate an upcoming reversal to the downside.
To effectively use candlestick patterns in crypto trading, you need to consider their context and confirm them with additional technical indicators or market analysis. Simply spotting a pattern isn’t enough; you also need to evaluate factors like trading volume, support and resistance levels, and overall market trends.
Example:
Suppose you notice a bullish engulfing pattern on a daily BTC/USD chart. While the pattern suggests potential upward movement, you should also check if trading volume increased during the bullish candle. Higher volume often strengthens the validity of the pattern. Additionally, confirming that the pattern occurs near a key support level can add further credibility to the signal.
Understanding candlestick patterns is just the first step. To truly benefit, you need to integrate them into a well-rounded trading plan. This includes:
Defining Entry and Exit Points: Use patterns to identify where to enter a trade and where to place your stop-loss or take-profit orders.
Combining Patterns with Other Indicators: Enhance accuracy by pairing candlestick patterns with moving averages, RSI, or MACD.
Practicing Consistency: Over time, consistently recognizing and acting on reliable patterns can lead to better results and improved trading confidence.
Candlestick patterns offer valuable insights into market sentiment, giving you an edge in the fast-moving world of crypto trading. By mastering the most common patterns, reading them in context, and integrating them into your broader strategy, you can navigate the volatile crypto landscape with greater precision and confidence.